
%20(1).png)
Hand holding a mobile phone displaying a CatalogIt entry of an artwork with the framed engraving in the background and a laptop screen showcasing a digital collection.
Reports, whether sent in the mail or saved as a PDF and emailed - are key in sharing information with your staff, volunteers, researchers, students, community, and scholars. Creating reports and printing from CatalogIt is a simple and quick way to share the information you choose with whomever you choose.
While some Collections Management Systems rely on complicated report writers such as PowerBuilder or Crystal Reports, CatalogIt allows you to create your customized report, with as much or as little information as you would like, on the fly. You can choose to include the primary image only or all images. You can print as a nicely pre-formatted document or extract the data in a spreadsheet. Even if your records are published to the web, these reports can be a great tool to capture additional information that you may not have chosen to publish but would like to share with researchers or scholars.
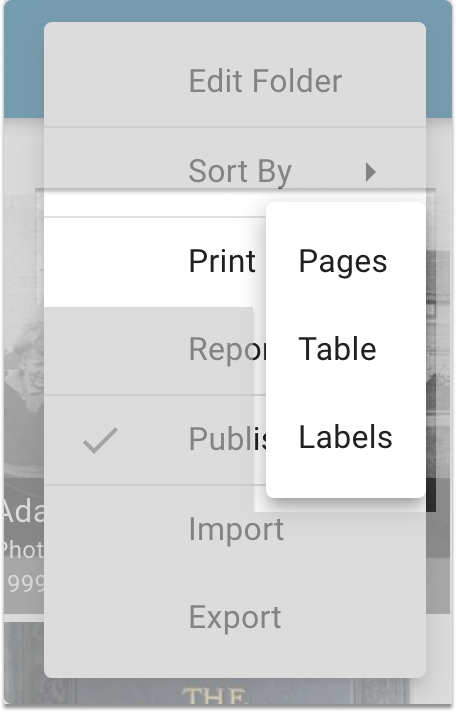
CatalogIt includes a few pre-formatted reports, but creating your own is a more targeted way to share your information. Simply start by selecting “print” from the actions menu. From here you can choose to print “pages”, “table”, or “labels.”
For a more robust report, select “Print Pages” - it is a friendly format that allows for a larger image and presents the text in an easy to read format. Next, you can choose to print the primary image or all images and select exactly which fields you want to include in your report. When you are done, select “print,” and use your computer’s settings to print either as a PDF or to your printer. It cannot be easier to provide your colleagues and researchers exactly the information they are looking for.
We have recently enhanced the reporting capabilities in our “Print Table” function. Users are now able to include the primary image (as a thumbnail) and QR codes when you use the print table function to export to Excel. You are able to include two types of QR codes in this report - one linking to the entry in your records, and, if you are publishing to the HUB, one for the QR code linking to the entry on your HUB page for public use.

The tabular report can be printed directly from CatalogIt or exported as an Excel file, allowing you to use that data in any way you need - object labels, interpretive documentation, or inventory lists.
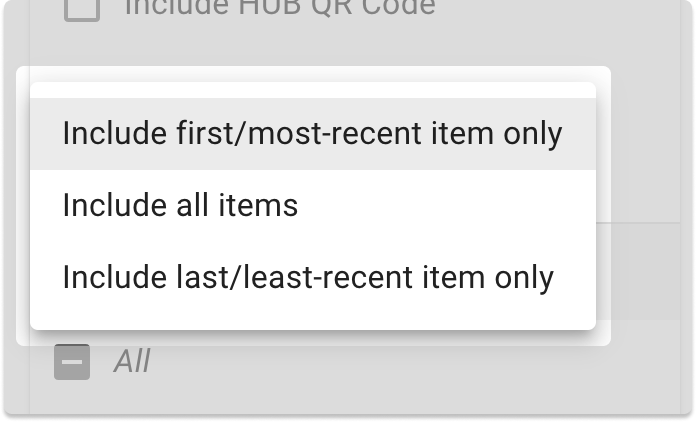
CatalogIt also enables you to decide what information to include when there is a repeating field - the most recent value only, all values, or the oldest value. This is especially helpful when printing locations or valuations - print only the most current location or valuation or the earliest - original value or location (or all of them if you would like!).
Last, the “Print Labels” function is a great way to print quick ID labels for your collection. Choose just the information you want, an image, and a QR code. There are two formats to choose from and print the labels with 3 - 6 rows - depending on the size you are looking for. These are also great to label the outside of a box or folder so you can clearly display the contents without having to physically handle everything.